Property market crash, likely?
April 11th 2018

Key Points
- Property prices in Sydney and Melbourne likely have more downside, but a crash is unlikely in the absence of much higher mortgage rates, much higher supply and a long continuation of recent high construction activity.
- Other cities will perform better.
- Property investors should remain wary of Sydney and Melbourne and focus on laggard or higher yielding markets.
Are you worried that an imminent crash will happen soon? Talk to one of our advisers and find out if worrying about it is necessary or not.
[ninja_form id=37]
Introduction
Australian capital city home prices fell 0.2% in March, their fifth monthly fall in a row. This has brought annual growth down to 0.8% from 11.4% in May last year. Most of the recent weakness relates to Sydney and to a less extent Melbourne.
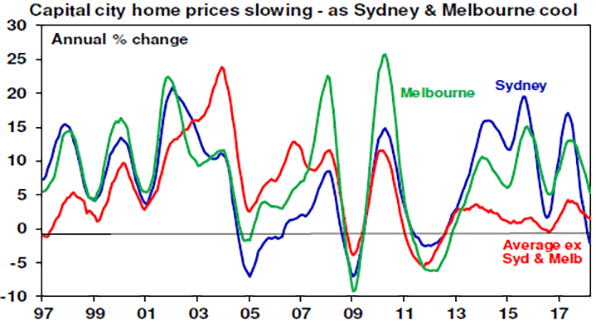
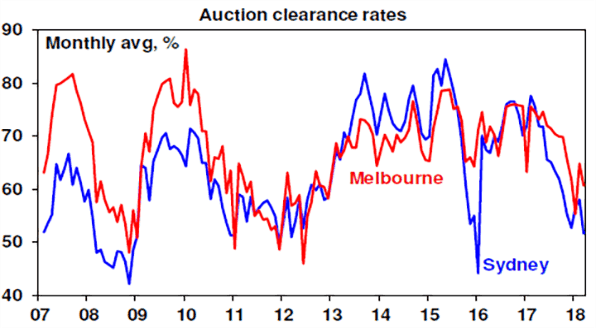
This is unusual in that property price downturns are usually preceded by significant interest rate increases. Consistent with the fall in Sydney and Melbourne property prices, auction clearance rates and home sales have also fallen.
How far will prices will drop? Will the weakness spread to other cities? And what will it mean for the broader economy?
Australia’s Achilles heel – the risk of a crash
With prices falling in Sydney and Melbourne some see this as the start of a crash. There is a good reason to be concerned:
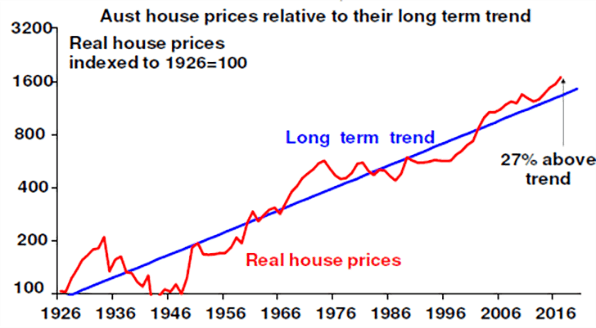
- Real capital city house prices are 27% above their long-term trend (see the next chart) and are at the high end of OECD countries in terms of the ratio of prices to income and rents.
- The surge in prices relative to income since the mid-1990s has gone hand in hand with a surge in the ratio of household debt to income that has taken it to the top end of OECD countries.
- With a long period of strong prices and low mortgage rates has come some deterioration in lending standards with the share of new interest-only loans reaching around 45% in 2015 and concerns about the reliability of borrowers’ income and living expense assessments when they take out loans.
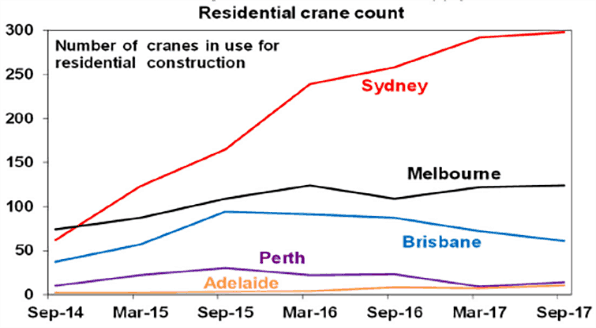
- Finally, there has been a surge in the supply of apartments, notably in Sydney evident in the high number of residential cranes in use, raising concerns about oversupply.
However, a crash remains unlikely
While crash calls and stories of mortgage stress are common, they have been repeated endlessly over the last 15 years. But, a crash (say a 20% national average price fall) remains unlikely:
First, the real driver of high home prices and their persistence has been that thanks to tight development controls and lagging infrastructure, the supply of dwellings has not kept pace with population-driven demand. Over the last decade annual population growth has averaged about 150,000 above what it was over the decade to the mid-2000s, which would require roughly an extra 50,000 new homes per year. But it’s only recently that supply has caught up with the pick-up in population growth. And population growth remains very strong.
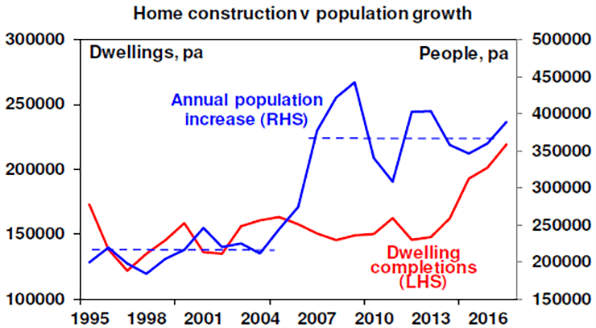
Consistent with this average capital city vacancy rates are at or below their long-term averages, notably in Sydney.
Secondly, while mortgage stress is a risk: there has been a sharp reduction in interest only loans since APRA strengthened lending standards; debt servicing payments as a share of income have actually fallen slightly over the last decade and Census data show that the share of owner-occupier households with a mortgage for which debt servicing is above 30% of income has fallen from 28% in 2011 to around 20%; a significant number of households with a mortgage are ahead on their repayments; and banks non-performing loans remain low. While there has been some deterioration in lending standards it does not appear to be anything like that seen with NINJA (no income, no job, no assets) loans in the US prior to the GFC.
Finally, it is dangerous to generalise. Property prices have surged in Sydney and Melbourne but have fallen in Perth and Darwin and have seen only moderate growth in other capitals.
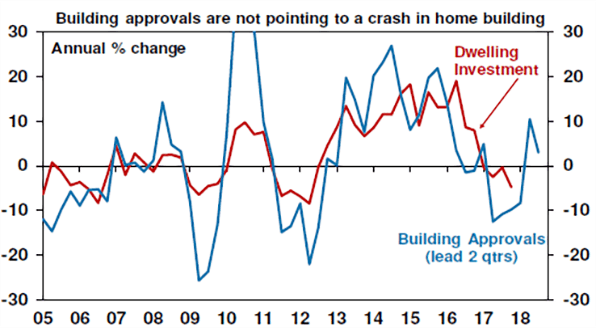
To see a property crash we probably need much higher interest rates or unemployment (neither of which are expected) or a continuation of recent high construction for several years (which is unlikely as approvals have cooled from their 2016 highs).
Outlook
A further tightening in lending standards as banks get tougher on borrowers’ income and living expense levels along with rising supply and more realistic capital growth expectations by home buyers will see Sydney and Melbourne property prices fall another 5% or so this year with further falls likely next year.
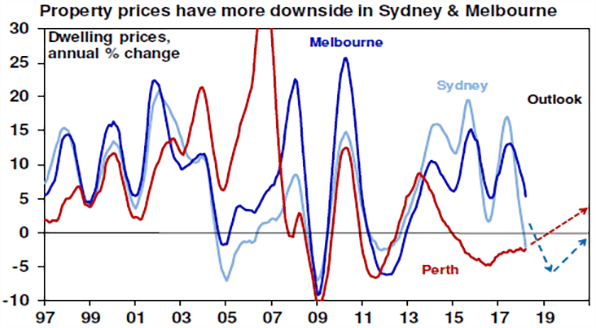
By contrast home prices in Perth and Darwin are either at or close to the bottom, price growth is likely to be moderate in Adelaide and Canberra, but it may pick up a bit in Brisbane thanks to stronger population growth and the boom in Hobart has a way to go yet.
Regional centres are likely to provide relatively faster capital growth reflecting weaker supply and offering more attractive rental yields (around 1.5 percentage points higher than in cities). Units are at greater risk given surging supply, but so far house prices have slowed more in Sydney and Melbourne.
The property cycle and the economy
A slowdown in the housing cycle can affect the broader economy via slowing dwelling construction, negative wealth effects on consumer spending and via the banks if mortgage defaults rise. However, as things currently stand the drag from housing construction is likely to be minimal – building approvals don’t point to a collapse in new construction (see the next chart) and it looks like alterations and additions will rise, negative wealth effects will weigh on consumers but not dramatically if we are right, and in the absence of a property price crash the impact on the banks will be manageable. Finally, other sectors of the economy are taking over from the housing, eg business investment and state capital works, as being growth drivers.
Implications for investors
There are several implications for investors:
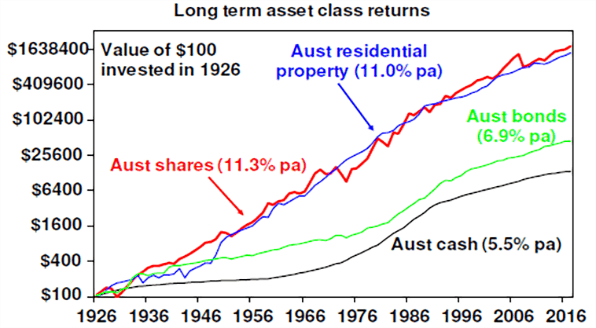
- Firstly, over the very long term residential property adjusted for costs has had a similar return to Australian shares (see next chart). Its low correlation with shares, lower volatility but lower liquidity makes it a good portfolio diversifier. So, there is clearly a role for property in investors’ portfolios.
- Secondly, there remains a case to be cautious regarding housing as an investment destination for now. It is expensive on all metrics and offers very low income (rental) yields compared to other growth assets. This means a housing investor is more dependent on capital growth.
- Thirdly, these comments refer to Australian housing overall but it’s dangerous to generalise. Other cities and regional property are far more attractive than Sydney & Melbourne.
If you are still concerned with the possible crash and its effects in the economy, get in touch with our advisers today.
[ninja_form id=41]
![]()
About the Author
Dr Shane Oliver, Head of Investment Strategy and Economics and Chief Economist at AMP Capital is responsible for AMP Capital’s diversified investment funds. He also provides economic forecasts and analysis of key variables and issues affecting, or likely to affect, all asset markets.